I recently collected dozens of temperature profiles from various things using the iSocket Historical Temperature Data (HTD) feature and shared my research in previous articles available on this blog — for example, this article.
Pipes Freezing Monitoring
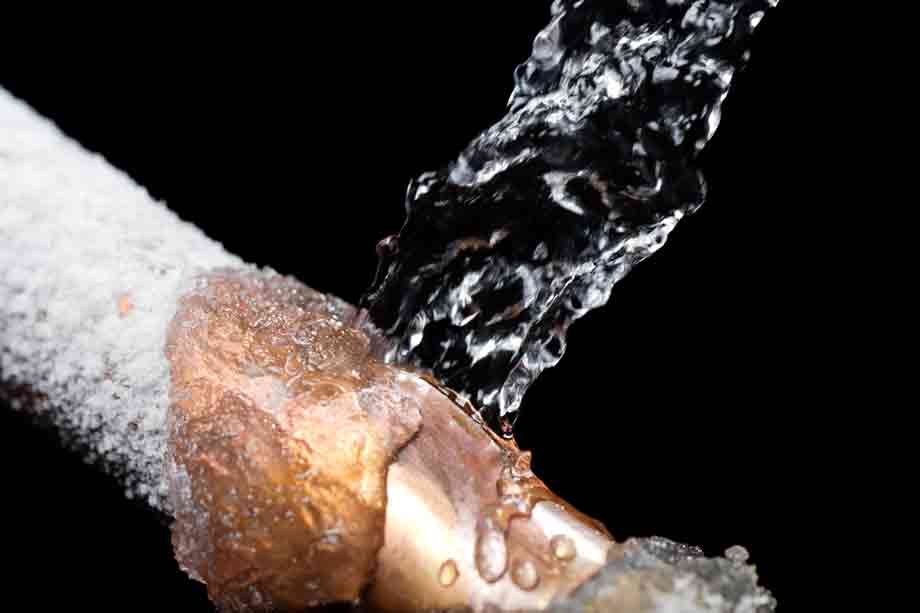
One of my applications was monitoring the temperature of pipes under the sink, which are vulnerable to freezing. By tracking temperature changes in these pipes, I can prevent potentially costly damage. The temperature fluctuates depending on whether hot water is flowing through them. It’s vital to monitor these variations, especially during significant temperature drops, to ensure the pipes don’t freeze.

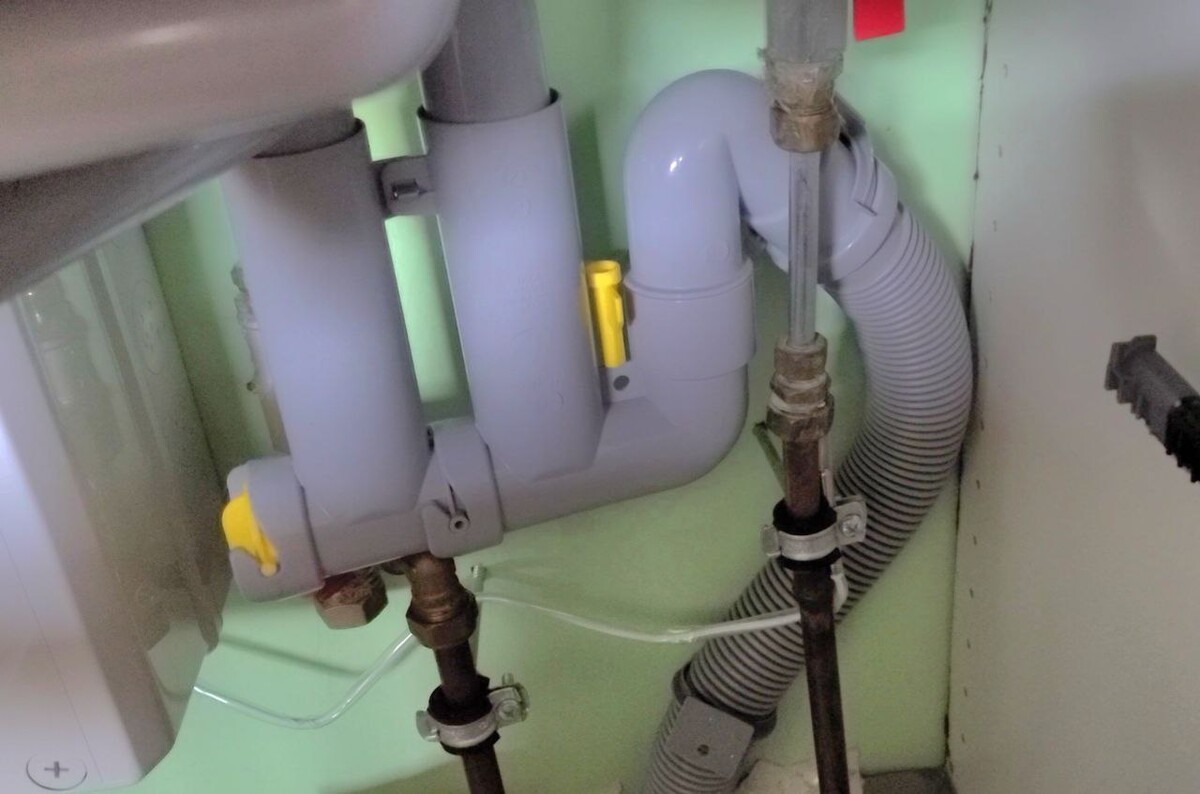
On the photo you can see the sensor connected to the pipe. The monitoring sensor provides real-time updates, helping me stay informed when the pipe temperature approaches freezing levels. For example, when the temperature approaches 0°C (32°F), I can take necessary actions like checking the insulation or activating heating elements to prevent the pipes from freezing. This proactive monitoring helps avoid issues like pipe bursts due to freezing.

Hot Water Usage Monitoring

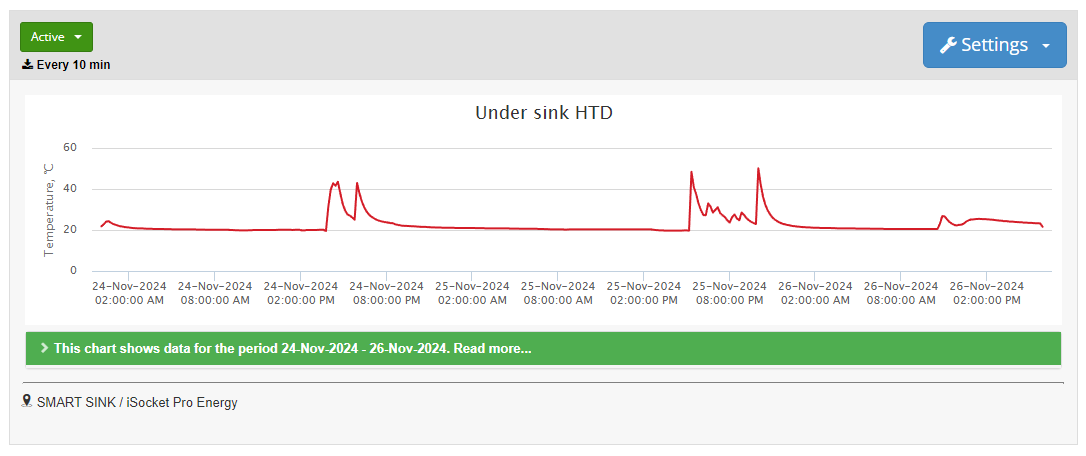
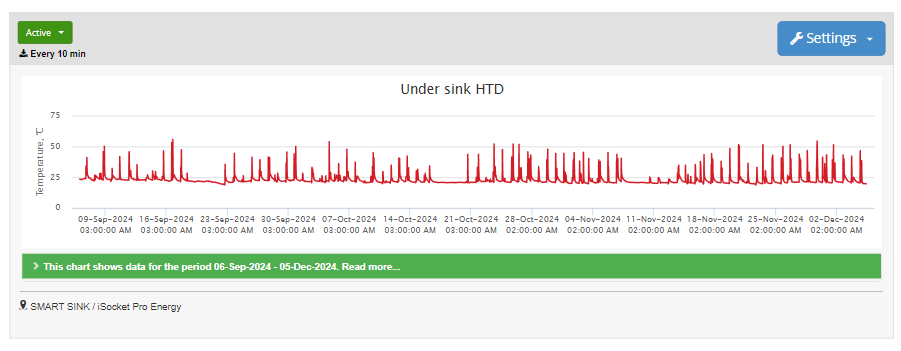
The temperature profile here shows spikes whenever the faucet is turned on, corresponding to the flow of hot water. By analyzing these temperature spikes, I can determine when and for how long water was used, allowing me to better understand household water consumption patterns and spot any irregular usage.
Keep in mind that with a 10-minute temperature collection interval, some water usage events might be missed. For example, if the temperature is recorded just before someone turns on the faucet, and then the new 10-minute interval starts, the temperature spike from the hot water flow may be missed if the pipe cools down quickly after the faucet is turned off.
For more accurate tracking, setting a temperature collection interval of one minute might be needed. It’s also worth noting that iSocket offers other tools like the iSocket WaterFlow Detector for monitoring water usage, though that’s separate from the temperature tracking (HTD) feature and won’t be discussed here.
Check out my video, where I cover various applications and insights from temperature profiles to get more in-depth information on this topic.

