What is the true temperature inside your fridge or freezer? Is it the number displayed on your fridge or freezer's panel? You might be surprised to learn that the actual temperature can vary significantly from what’s shown. In this post, we'll uncover these discrepancies and explain why understanding the real temperature matters.
Using the iSocket Temperature Sensor Specific and the iSocket Historical Temperature Data (HTD) feature, I’ve been tracking temperature profiles across various fridges and freezers. I introduced the concept of temperature monitoring in various environments in my first article about the HTD feature — you can find it here. Additionally, I’ve recorded a detailed one-hour video on the topic, which is shown at the end of this post.
In the first article, I highlighted the importance of monitoring a home freezer and shared how it once helped me avoid a significant issue. If you missed it, check out the details there. Today, we’ll continue by exploring the temperature profile of a garage freezer and delve deeper into why accurate temperature monitoring is essential.
The Temperature Profile of a Chest Freezer
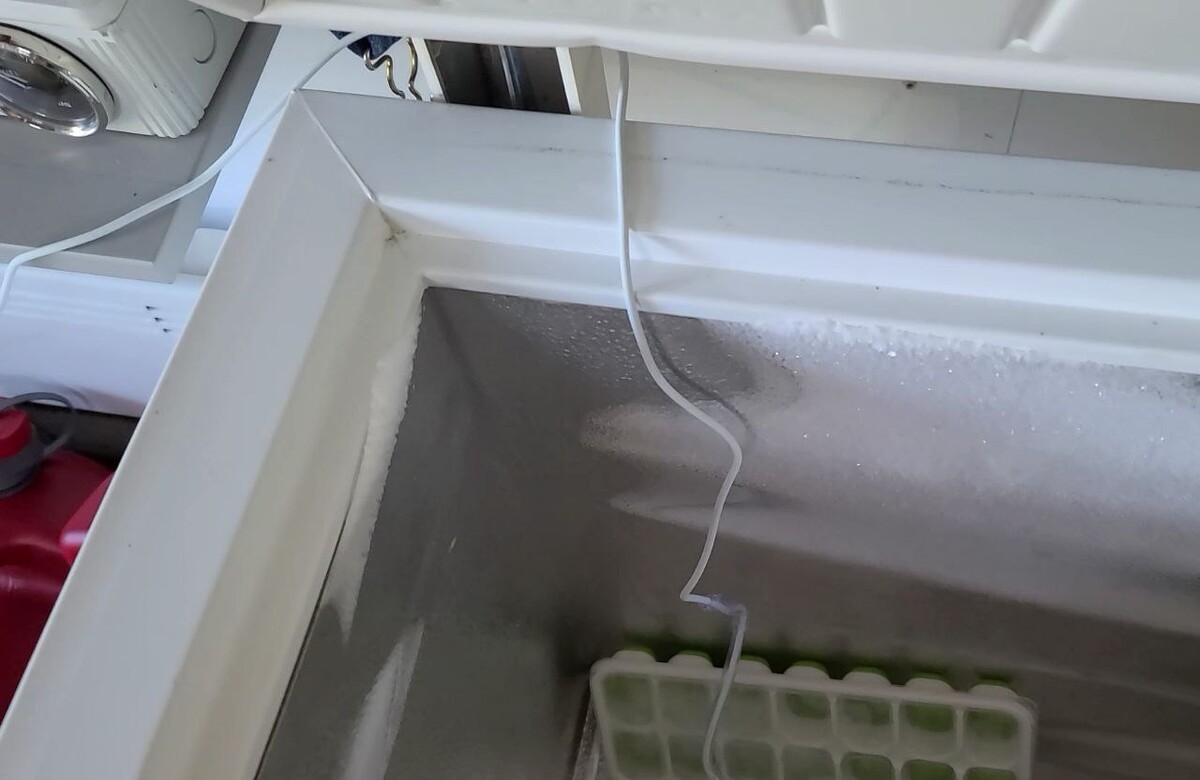
Let’s take a closer look at this chest freezer, which doesn’t have a digital temperature display. Instead, you adjust the temperature using a manual knob, and it operates like a traditional compressor-based freezer. The compressor cycles on and off to maintain the temperature you’ve set with the knob. In fact, this is how most freezers work — alternating between running and stopping the compressor. So, what does the temperature profile reveal? Let’s examine it.
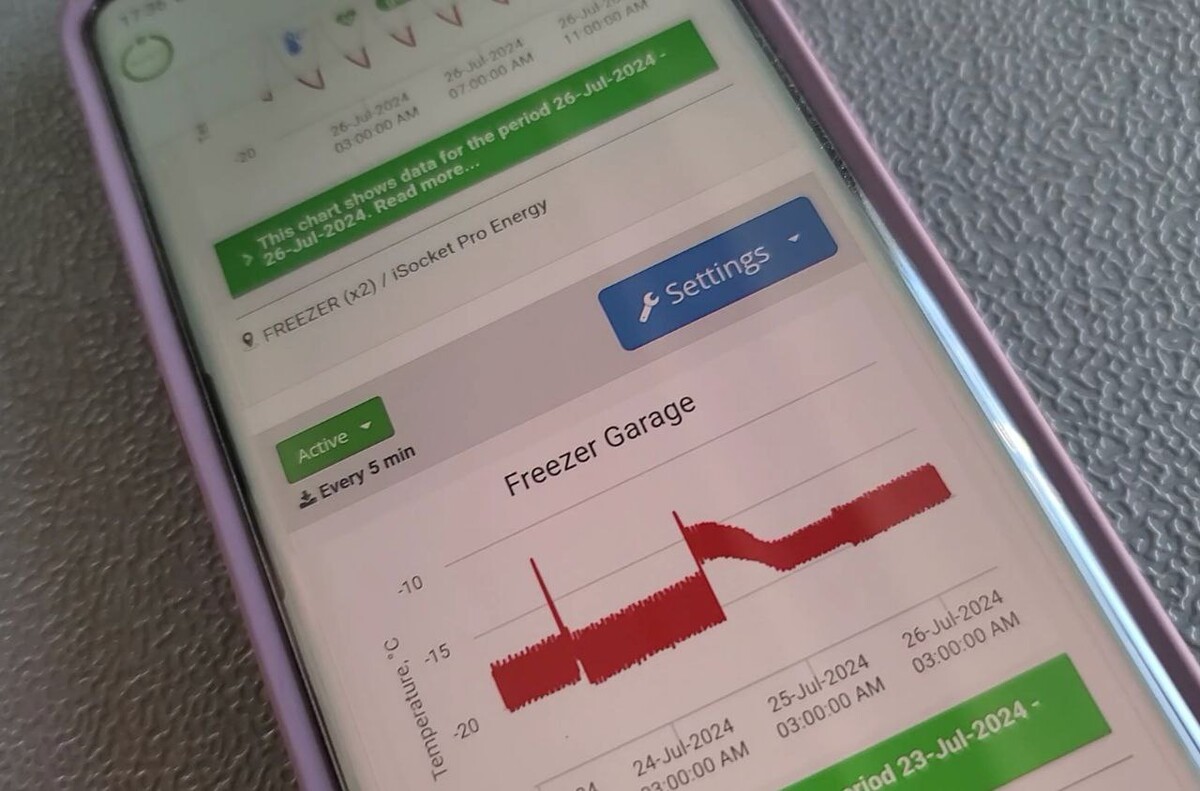
Here is the temperature profile of the chest freezer recorded over three days, as displayed on a phone via the iSocket Progressive Web App. The chart shows that the temperature fluctuates between approximately -18°C (0°F) and -21°C (-6°F). You’ll notice occasional spikes — these occur when the freezer door is opened.
Pro Tip: If you want to avoid monitoring these spikes, consider using glycol. Placing the sensor in glycol helps smooth out these fluctuations. I plan to experiment with this setup soon and share the results with you.
In the middle of the chart, there’s a significant spike followed by a gradual cooling period. This is what happens when the freezer door is left open for an extended time.
Now, think about your own freezer or fridge with a digital temperature display. What happens when you open the door for a brief moment? Does the temperature reading on the display change? Likely not! If it shows -18°C (0°F), it will stay the same, even after the door has been opened. Perhaps after a few minutes, it might shift to -17°C (1°F), but it certainly won’t show something like -12°C (10°F).
And when the door remains closed, does the display show any fluctuations at all? No, it doesn’t. Let’s take a closer look at a three-hour sample to analyze this behavior.
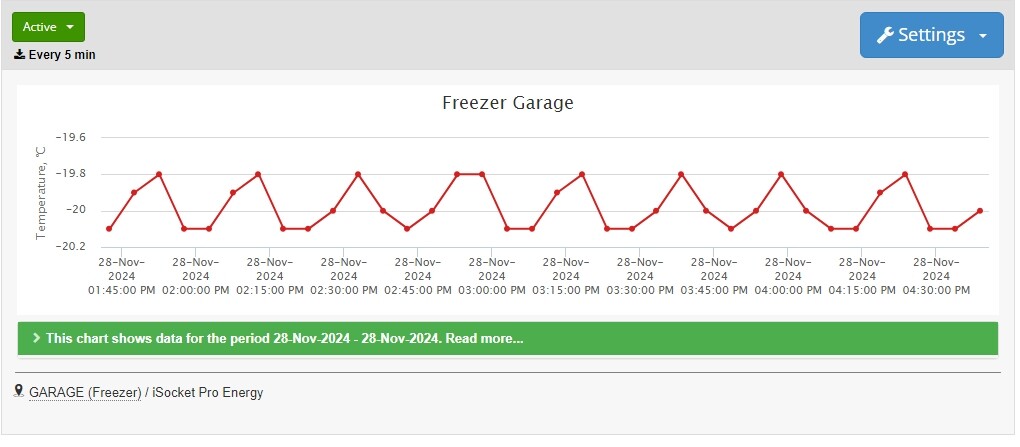
As you can see, the temperature fluctuates between approximately -21°C (-6°F) and -19°C (-2°F). Comparing this with the multi-day profile shared earlier, I decided to set up temperature rise alerts for this freezer at -17°C (1°F). I’ll dive into this topic in more detail later.
Now, let’s also take a look at a one-day profile for this freezer alongside the home freezer mentioned in the first article.
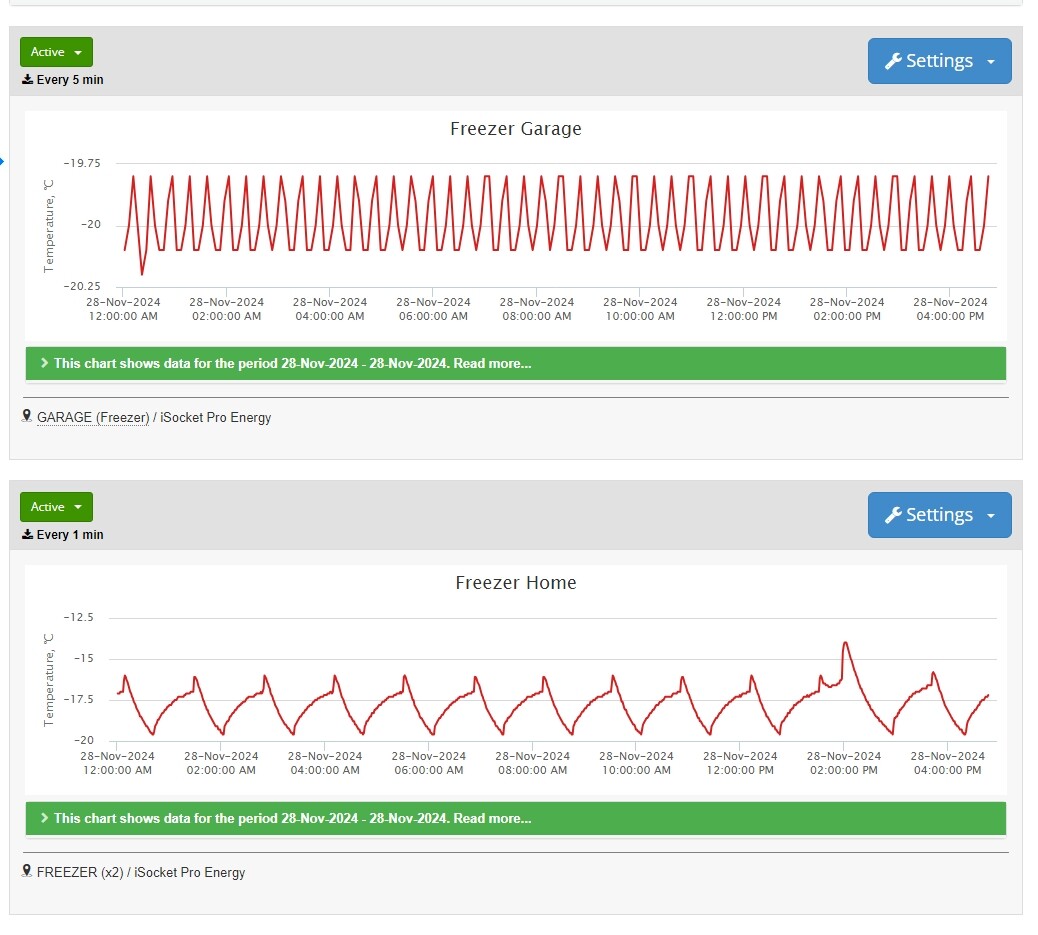
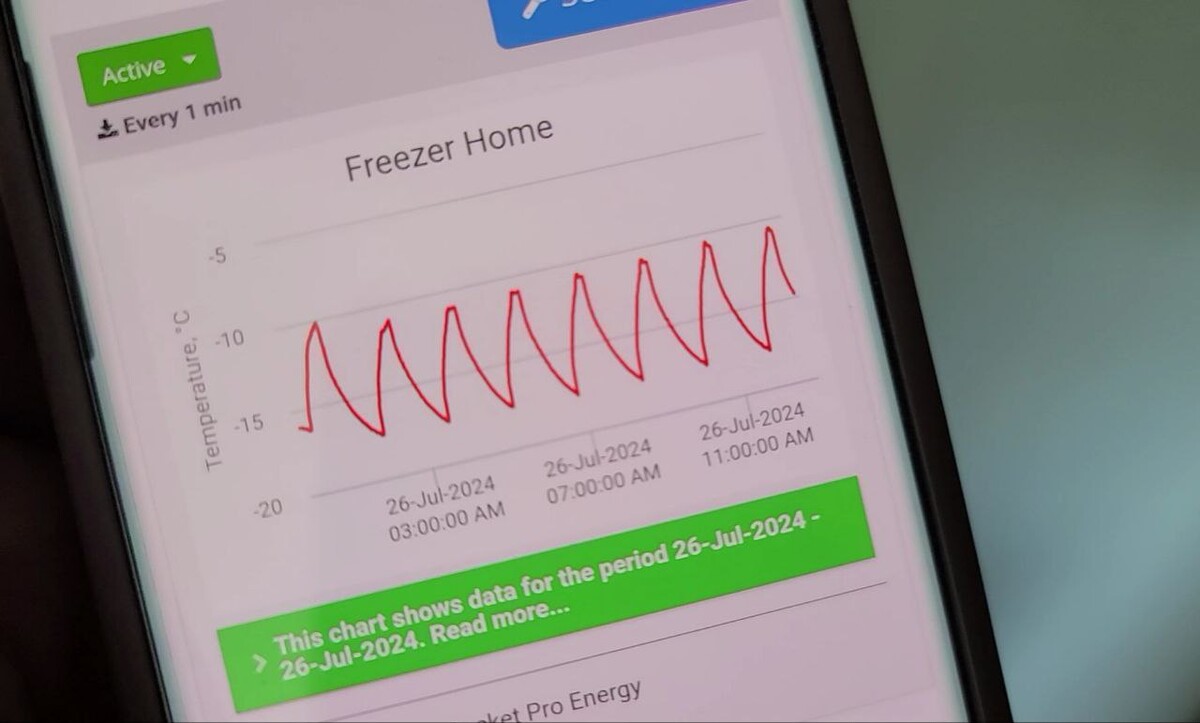
You can see that the garage freezer maintains a very stable temperature, almost perfectly holding the set range. Meanwhile, the home freezer heats up to approximately -16°C (3°F) and, at some points, even to -15°C (5°F) when the compressor is off. Despite this, the display on its door always shows -18°C (0°F):
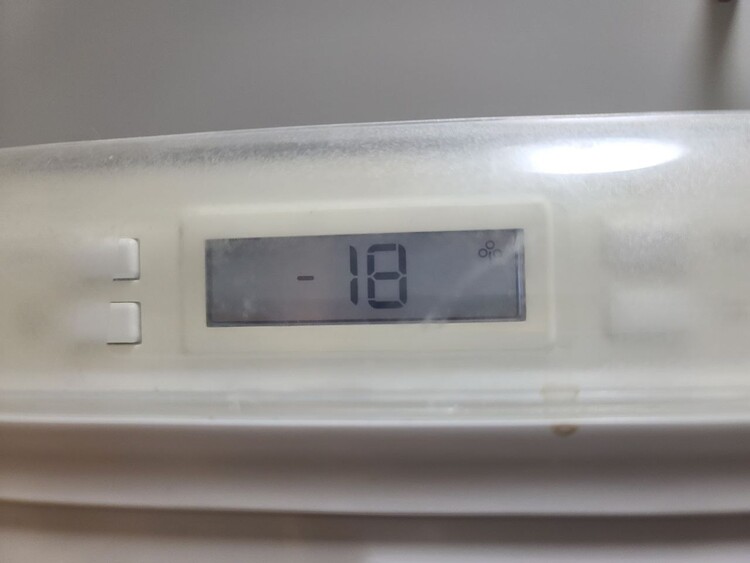
Manufacturers provide fake information for you as an end user to avoid surprising you. However, when you place a sensor inside, you can monitor the true temperature without any deception. When the compressor stops, the freezer warms up, and the temperature rises, but when the compressor runs, the temperature drops again.
A Note on the Protective Sleeve for the iSocket Sensor
The iSocket Temperature Sensor Specific comes with a PVC protective sleeve designed primarily for use in environments like saltwater fish tanks or aquariums. However, in colder settings, such as freezers, this sleeve can become brittle and may crumble over time. While this does not impact the sensor's functionality, it might not look appealing so in some cases you may decide to remove it.
On my photo above, you can see that I decided to keep it and have no issues.
Temperature Profile of the Home Refrigerator
Let's take a look at the large Electrolux refrigerator set to 5°C (41°F). Below you will find its temperature profile for one day, without opening the doors.
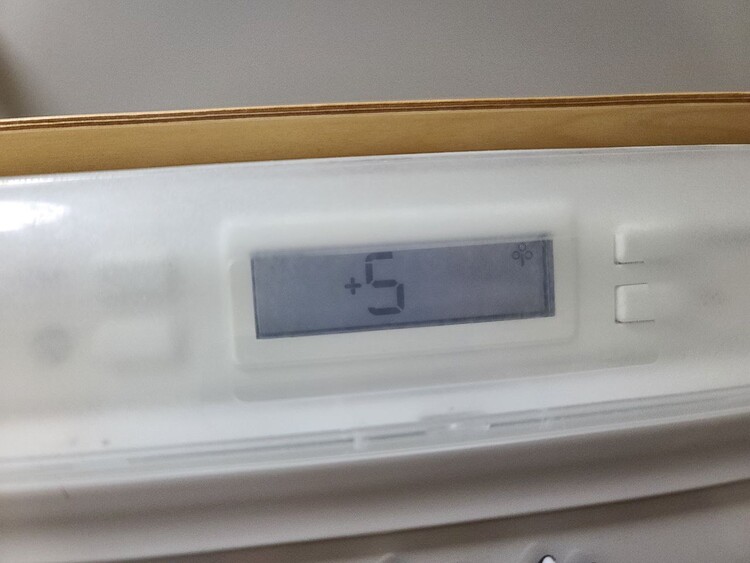
As you can see on the chart below, it never actually shows 5°C (41°F) — the temperature always stays higher. So, it's set to 5°C (41°F), and while it does drop, it never actually reaches 5°C (41°F). Why is that? Well, it’s also about the sensor's location inside this fridge. But you can see that when the temperature rises, it goes up to 10°C (50°F) at the sensor's location.
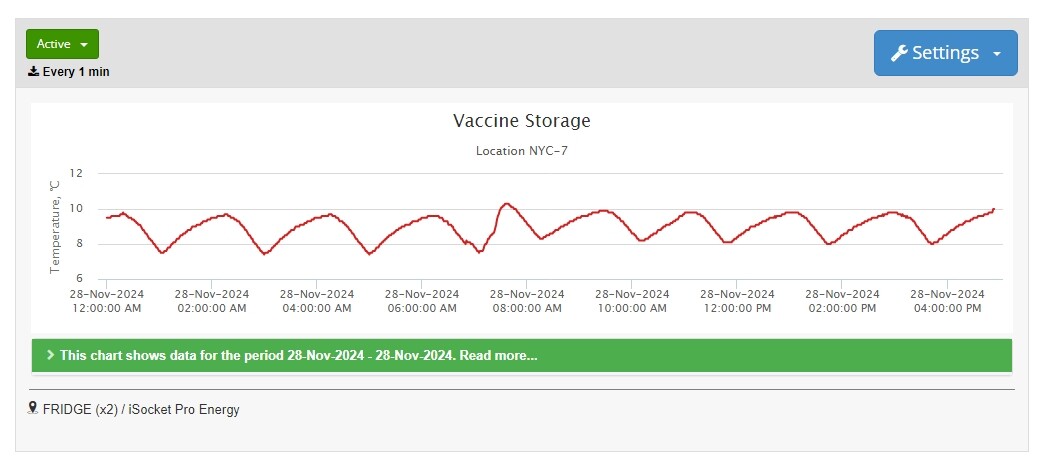
“If you’re monitoring a specific location in your fridge for sensitive items, like vaccines, you need to place the sensor close to that area to get accurate readings”.
So, in your large fridge, the temperature can vary quite a bit. Even if you set it to 5°C (41°F), you might not have 5°C (41°F) in most areas—maybe only in one spot near the compressor, typically at the bottom of the fridge if it’s a standalone model. In other areas, you could see temperatures as high as 10°C (50°F). So, if you’re monitoring a specific location in your fridge for sensitive items, like vaccines, you need to place the sensor close to that area to get accurate readings.
Temperature Rise Alerts for Refrigerators and Freezers
So, now that I know the temperature profiles of my refrigerators and freezers, I can set appropriate temperature rise alerts for them.
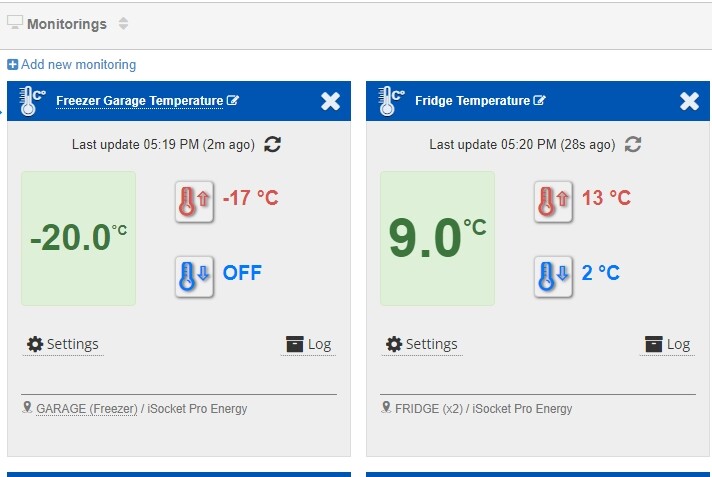
As mentioned above, for the freezer, I set the alert to -17°C (1.4°F), and even then, I sometimes receive notifications. However, this doesn’t worry me because I can always check the current temperature, as shown in the screenshot above.
My notification for temperature rises in the refrigerator is set to 13°C (55.4°F), because if I were to set the fridge to 5°C (41°F) and the notification at, say, 9°C (48.2°F), I would receive frequent alerts. I used to have notifications set at 9°C (48.2°F). Now, I’ve set my notification to 13°C (55.4°F). If anything happens, I’ll get a notification, most likely due to the door being opened or the refrigerator being damaged.
Temperature Changes in the Laboratory Freezer
In the laboratory, I use temperature sensors to monitor the freezer that stores various samples. The sensor helps track the actual internal temperature, which is critical for storing temperature-sensitive materials. The freezer’s temperature fluctuates during daily operation due to the compressor's on-and-off cycles. Additionally, when the door is opened, there are spikes in the recorded temperature, as shown on the iSocket HTD chart below. However, once the door is closed, the freezer quickly returns to the desired temperature, with an average of -18°C (0°F).
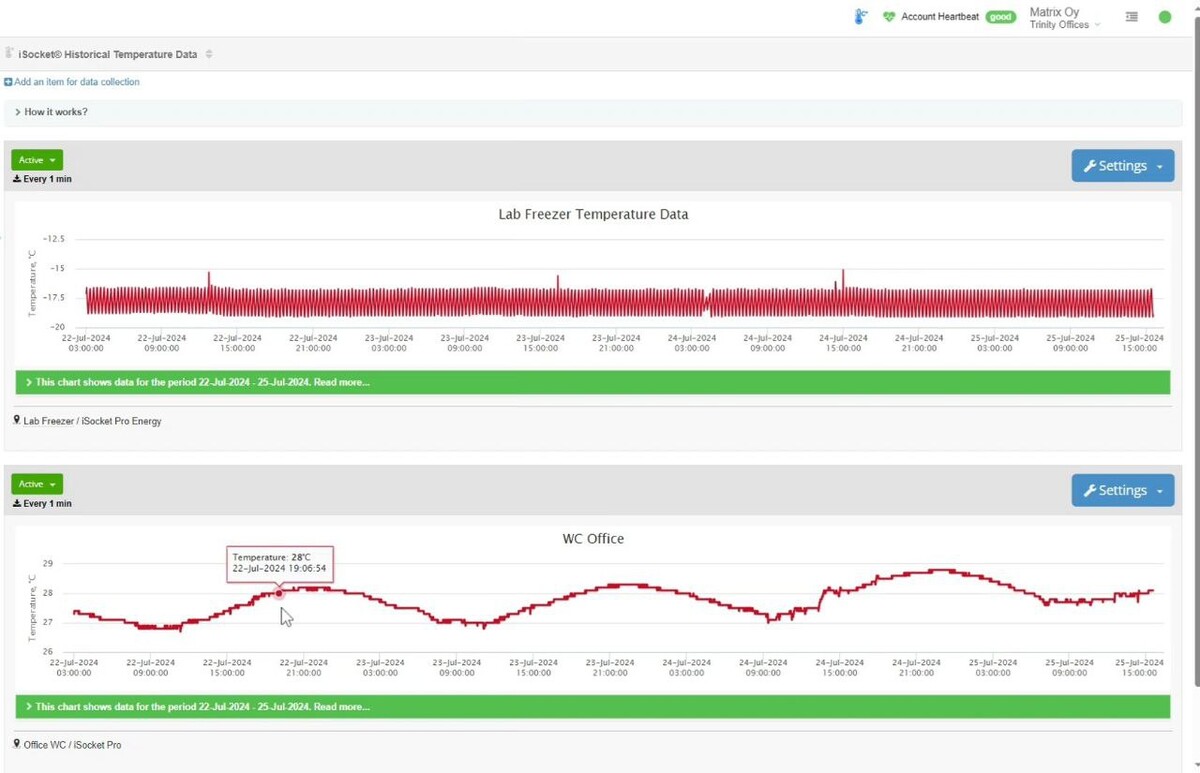
You don’t want to set notifications for temperatures like -16°C (3°F) for this freezer, as you’ll receive alerts every time the door is opened. A better option would be to set alerts for temperatures above -15°C (5°F) or -14°C (7°F).
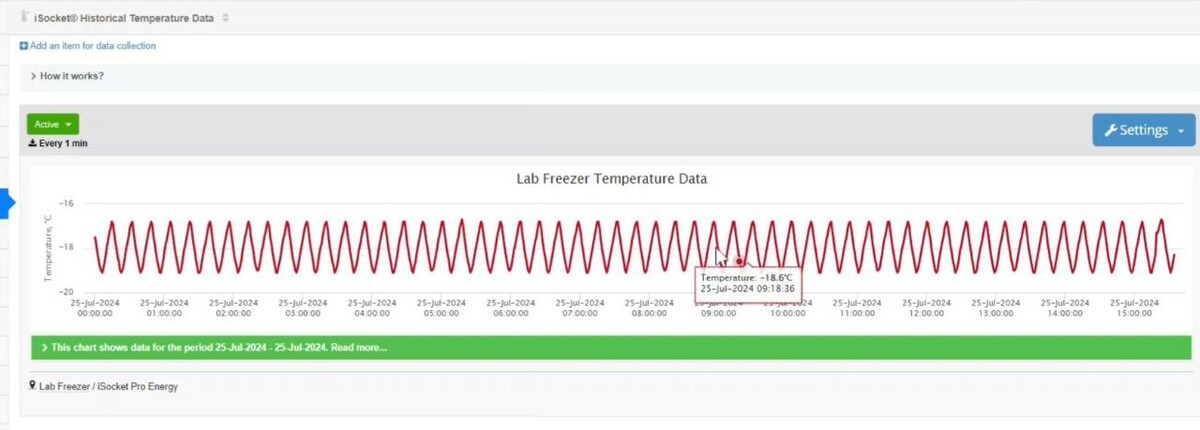
This particular freezer is new, by the way. The reason I’m pointing this out is that when I switch to one day of data — see below — I can observe how the compressor operates perfectly, cycling on and off. If this freezer had an indicator, it would consistently display a reading of -18°C (0°F), but as we discussed earlier, this is misleading data. For end users, the freezer shows the set temperature, not the actual internal temperature. The iSocket Temperature Data Logger, however, provides the true temperature readings, giving you a clear picture of what’s really happening.
How to Tell if Your Refrigerator is Malfunctioning?
These temperature profiles from iSocket Temperature Data Loggers can be analyzed in even more interesting ways. In my next article about portable refrigerators and temperature monitoring, I’ll show other intriguing insights you can discover about your fridge or freezer by studying its profile. Read that article here.
And just a reminder, this topic, along with an analysis of other temperature profiles, is covered in my video. You can use the timecodes in the description to jump to the section of the video that interests you.

